PFAS is a global challenge that requires technical nuance to understand. That nuance can show up in your PFAS report. Knowing what to look for and how to find it in a complex report is key to getting the most out of your PFAS monitoring program.
At FREDsense, we have created reports for over 7,000 PFAS samples and have read hundreds of third party lab reports. We’ve compiled the lessons we have learned along the way for you.
In this article you will learn:
- Key Terms to know before you dig into the report
- How to read a PFAS lab report
- What to look for, red flags in your data, and how to take action on your results
Let’s dive in.
Key Terms and Units Found in a PFAS Report
PFAS reports can be technically dense, filled with acronyms, numeric values in extremely low concentrations, and laboratory-specific terminology.
A clear understanding of the key terms and units is essential for accurately interpreting data and determining whether further action is required.
Understanding PFAS Acronyms (PFOA, PFOS, etc.)

PFAS acronyms are structured to convey key chemical characteristics of each compound. They can generally be broken down into components:
Numbers in Front: The numbers represent the number of carbons that are fluorinated and non-fluorinated in the compound.
PFAS Class Type: The first two letters often indicate the broader chemical class (e.g., PF for perfluoroalkyl or polyfluoroalkyl).
Carbon Chain Length: The next letter or abbreviation denotes the length of the fluorinated carbon chain. For example:
– B = Butanoic acid (4 carbon atoms)
– Hx = Hexanoic acid (6 carbon atoms)
– O = Octanoic acid (8 carbon atoms)
Functional Group: The final portion of the acronym identifies the terminal functional group, which defines the compound’s behavior and reactivity:
– A = Carboxylic acid (e.g., PFOA)
– S = Sulfonic acid (e.g., PFOS)
Sample Overview
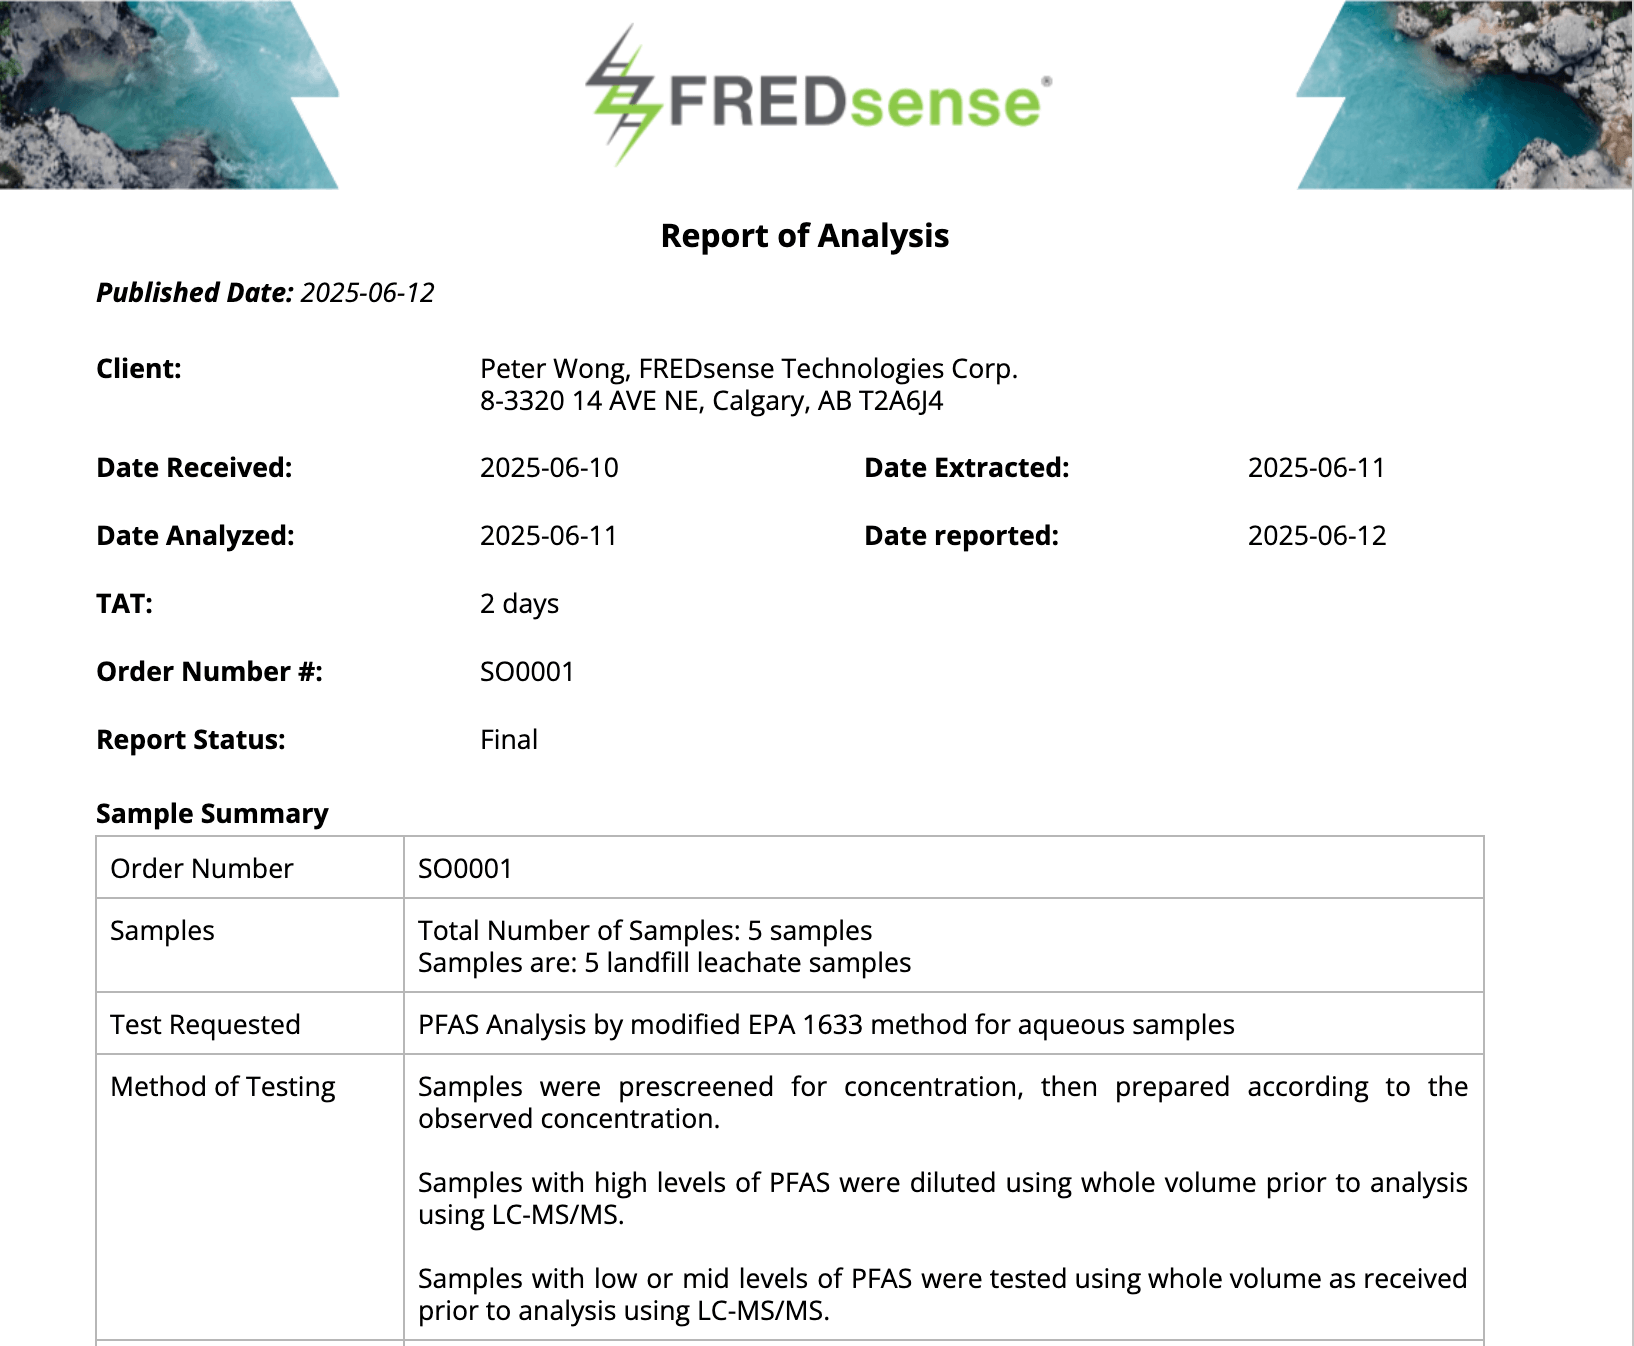
This section provides the contextual metadata for the samples submitted:
- Client/Project Information
- Sampling Date and Time
- Sample Preservation and Holding Time Compliance
- Chain of Custody (CoC) Reference
These details are critical to tracking which samples are for which parts of your sampling program. Knowing when the samples were analyzed, what project they are from, and how long they took to be analyzed is the first step to understanding your PFAS report.
PFAS Analysis Results

This is the core of the report: the quantitative data for each PFAS analyte tested. Results are typically displayed in tabular format, with each row representing an individual compound and columns showing:
- Sample Identification (ID)
- Matrix Type for Each Sample
- Analyte Name (e.g., PFOS, PFOA)
- Result (ng/L or µg/kg)
- Reporting Limit (RL)
- Detection Flag
This is where you will spend most of your time to understand what the data is saying and how you can use it.
Quality Control and Comments

This section outlines the laboratory’s QA/QC performance for the analytical batch, providing transparency on the validity and reliability of results. It typically includes:
- Surrogate Recoveries
- Method Blank and Laboratory Control Sample (LCS) results
- Matrix Spike/Matrix Spike Duplicate (MS/MSD) recoveries
- Field and Trip Blanks
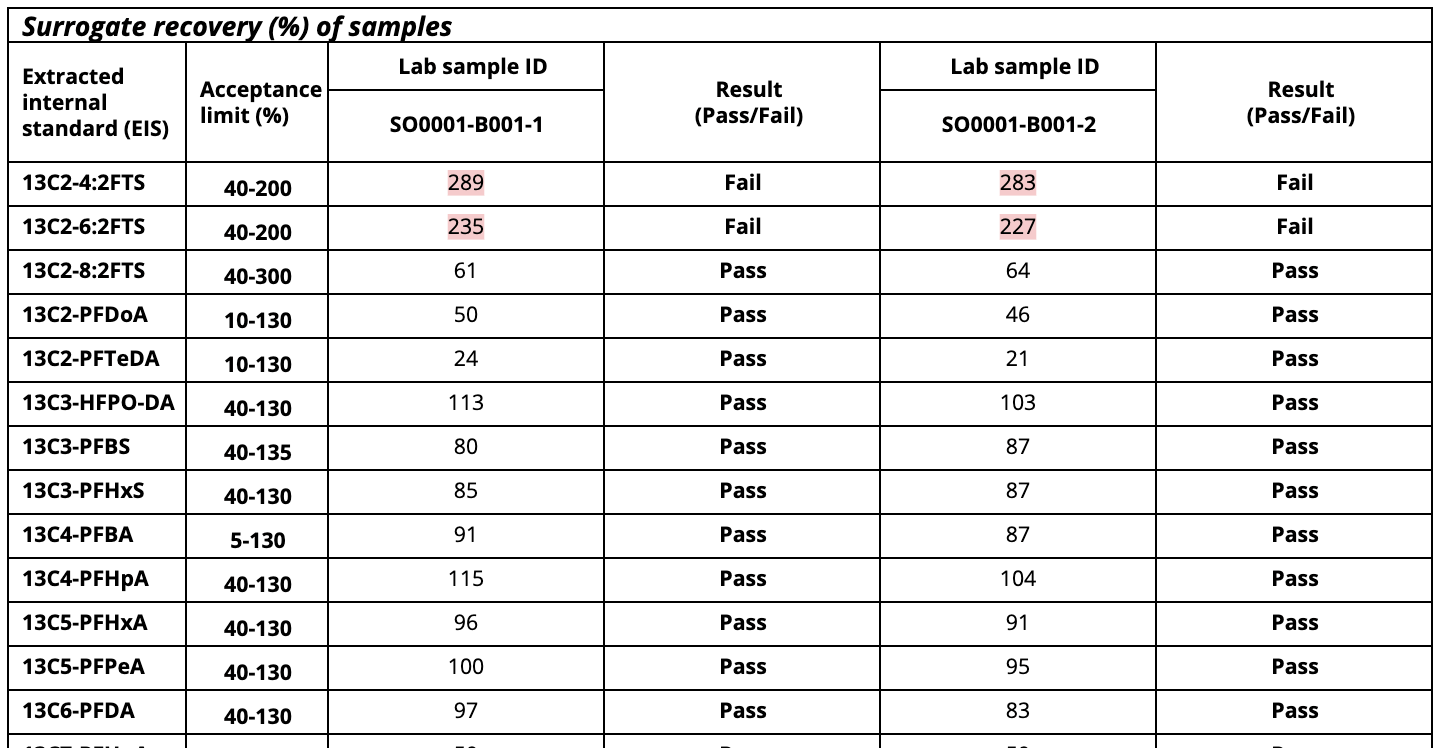
Surrogate Recoveries
A surrogate is a compound that is deliberately added to a sample before analysis. It can be the isotopically labeled PFAS analogs or a grouping of compounds.Surrogates are added to each sample to verify the performance of the extraction and analysis process.
Recoveries for PFAS analysis can vary widely from contaminant to contaminant. For Example, here are the EPA 1633 acceptable recoveries:
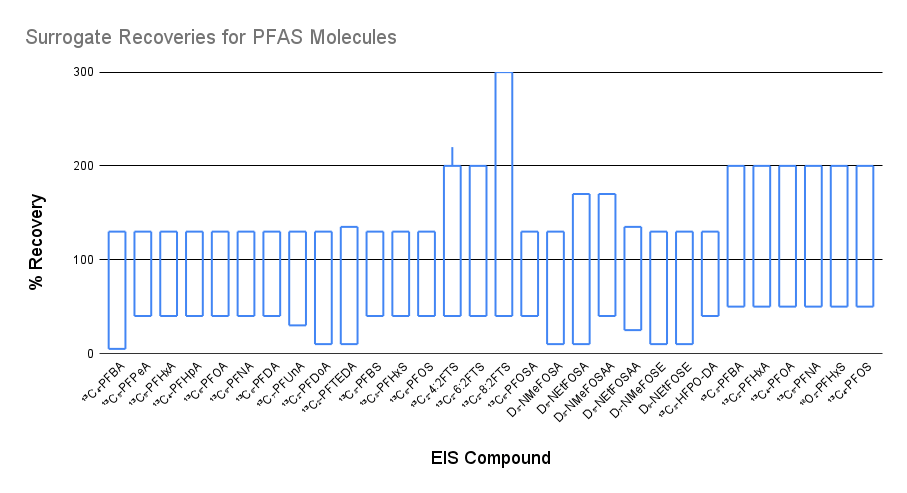
These recoveries can range from 70-130% all the way to 10-300% for different PFAS compounds. Huge swings that can have major implications for your data.
Labs will often offset these recoveries with a correction factor. When recoveries are very low or very high, this can introduce extra error in your analysis.
💡Pro Tip: Poor surrogate recovery can undermine the validity of the associated PFAS concentrations, especially for compounds reported as “non-detect.”